A tool to extract meaningful health information from large accelerometer datasets. The software generates time-series and summary metrics useful for answering key questions such as how much time is spent in sleep, sedentary behaviour, or doing physical activity.
Installation
Minimum requirements: Python>=3.7, Java 8 (1.8)
The following instructions make use of Anaconda to meet the minimum requirements:
Download & install Miniconda (light-weight version of Anaconda).
(Windows) Once installed, launch the Anaconda Prompt.
Create a virtual environment:
$ conda create -n accelerometer python=3.9 openjdk pip
This creates a virtual environment called
accelerometerwith Python version 3.9, OpenJDK, and Pip.Activate the environment:
$ conda activate accelerometer
You should now see
(accelerometer)written in front of your prompt.Install
accelerometer:$ pip install accelerometer
You are all set! The next time that you want to use accelerometer, open the Anaconda Prompt and activate the environment (step 4). If you see (accelerometer) in front of your prompt, you are ready to go!
Getting started
To extract a summary of movement (average sample vector magnitude) and (non)wear time from raw Axivity .CWA (or gzipped .cwa.gz) accelerometer files:
$ accProcess data/sample.cwa.gz
<output written to data/sample-outputSummary.json>
<time series output written to data/sample-timeSeries.csv.gz>
The main output JSON will look like:
{
    file-name: "sample.cwa.gz",
    file-startTime: "2014-05-07 13:29:50",
    file-endTime: "2014-05-13 09:49:50",
    acc-overall-avg(mg): 32.78149,
    wearTime-overall(days): 5.8,
    nonWearTime-overall(days): 0.04,
    quality-goodWearTime: 1
}
To visualise the time series and activity classification output:
$ accPlot data/sample-timeSeries.csv.gz
<output plot written to data/sample-plot.png>
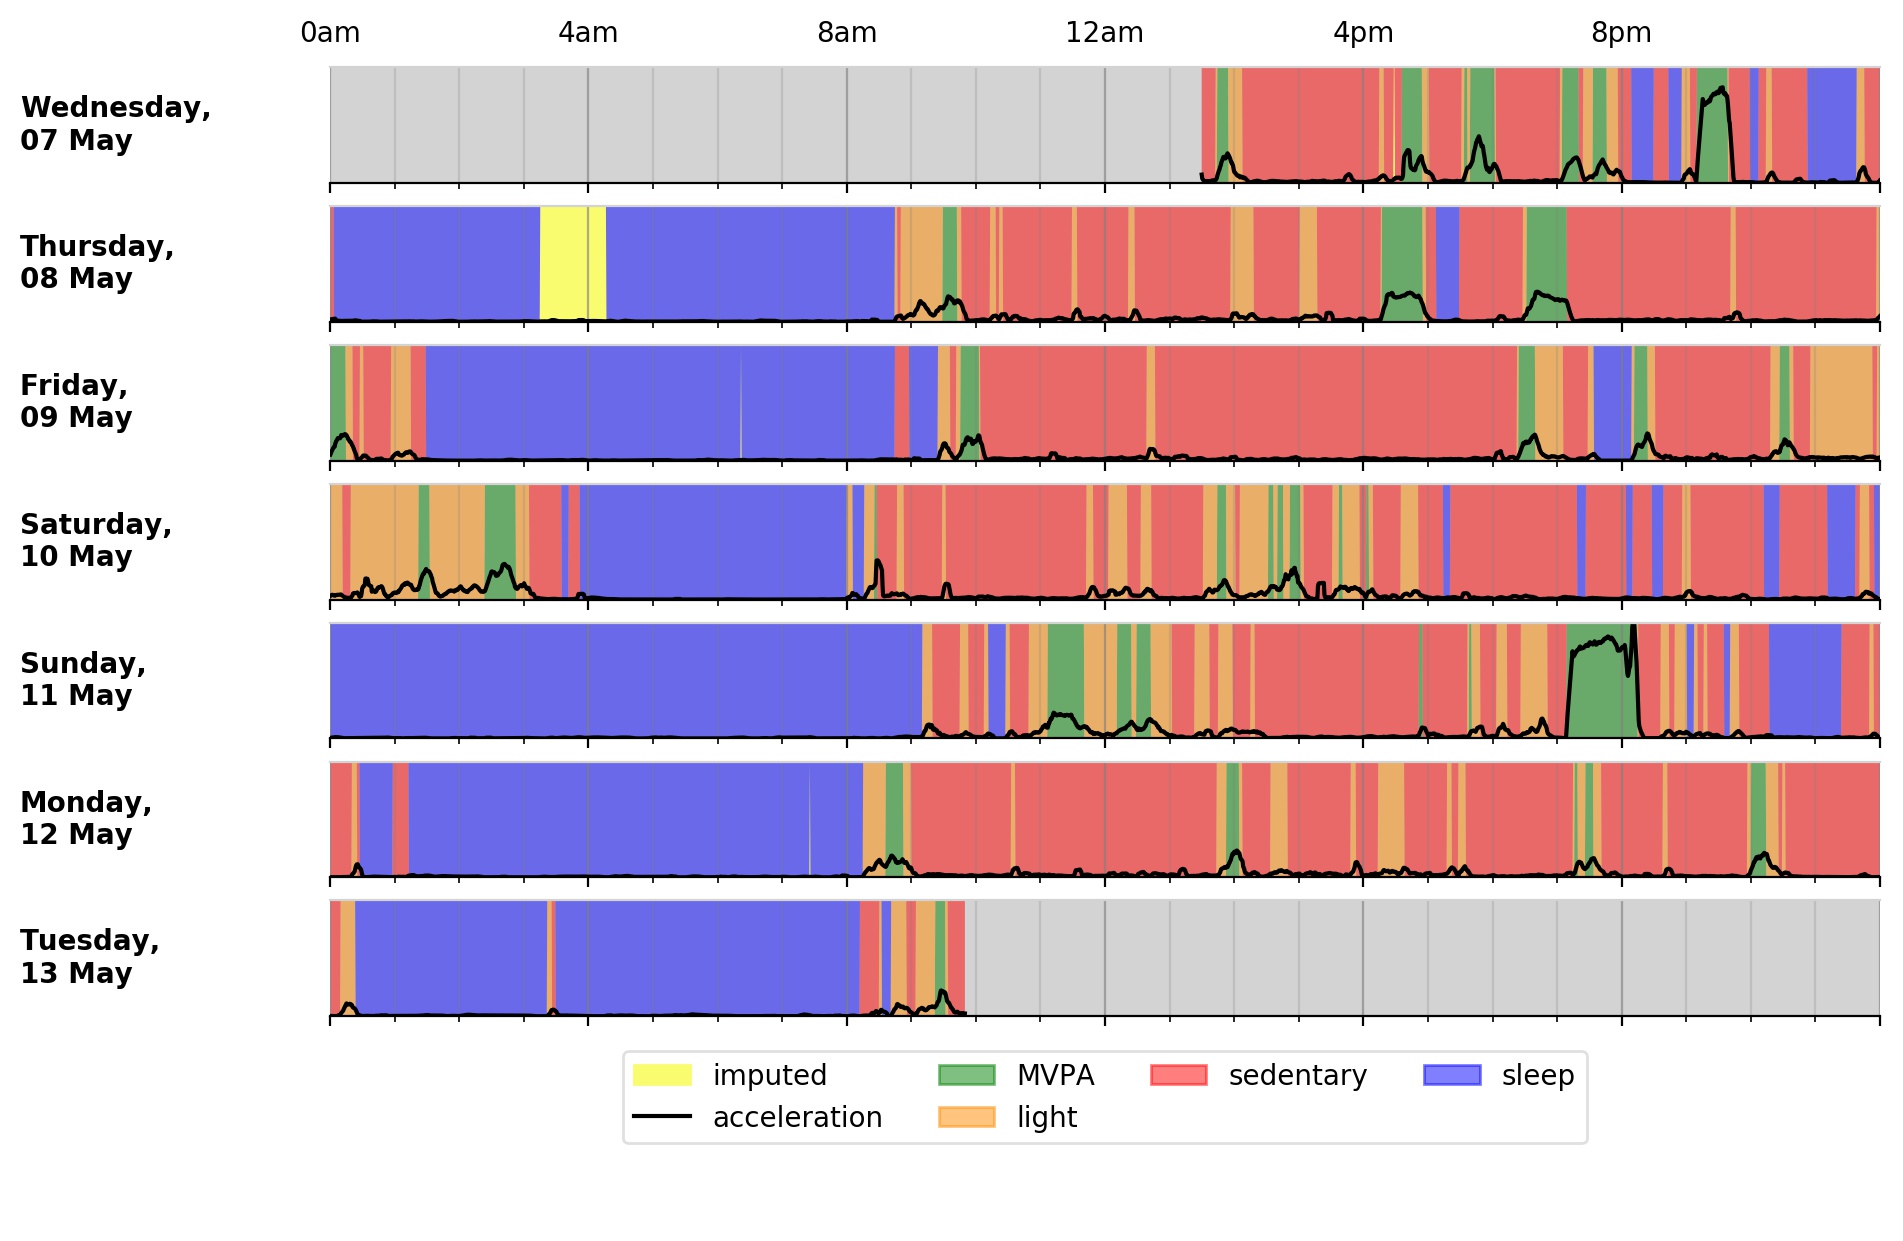
Output plot of overall activity and class predictions for each 30sec time window
Citing our work
When using this tool, please consider the works listed in CITATION.md.
Licence
See LICENSE.md.
Acknowledgements
We would like to thank all our code contributors and manuscript co-authors. Contributors Graph.
Contents: